

Big Claims About Tiny Numbers Willis Eschenbach
Big Claims About Tiny Numbers Willis Eschenbach
Ooogh … gonna be hard to determine their genders. Can’t just check their names, that would be transphobic. Have to contact each one and ask them about their sexual proclivities … that’ll go over well


Big Claims About Tiny Numbers
Guest Post by Willis Eschenbach
Our marvelous host, Anthony Watts, alerted me about a new paper yclept “New Record Ocean Temperatures and Related Climate Indicators in 2023“.
Of course, since I’m “the very model of a modern major general”, my first thought was “Is there gender balance among the authors as required by DEI?”. I mean, according to the seminal paper “Ocean sciences must incorporate DEI, scholars argue“, that’s a new requirement. Not balance by sex. Balance by gender.
However, it turns out that there are thirty-five authors of the new paper. I downloaded the citation. It says “Cheng, L., Abraham, J., Trenberth, K., Boyer, T., Mann, M., Zhu, J., Wang, F., Yu, F., Locarnini, R., Fasullo, J., Zheng, F., Li, Y., Zhang, B., Wan, L., Chen, X., Wang, D., Feng, L., Song, X., Liu, Y., Reseghetti, F., Simoncelli, S., Gouretski, V., Chen, G., Mishonov, A., Reagan, J., Von Schuckmann, K., Pan, Y., Tan, Z., Zhu, Y., Wei, W., Li, G., Ren, Q., Cao, L., Lu, Y.”
Ooogh … gonna be hard to determine their genders. Can’t just check their names, that would be transphobic. Have to contact each one and ask them about their sexual proclivities … that’ll go over well …
In addition, there’s a numerical problem with genders.
Here, from the San Francisco “GIFT” program, which will give $1,200/month in taxpayer money preferentially to illegal alien ex-con transgender prostitutes with AIDS who can’t speak English, is their checkbox list of genders. (And no, I’m not kidding—that is their preferred recipient, the person that goes to the head of the line for “free” taxpayer money. But I digress…)
So buckle up and keep your hands in the vehicle at all times, let’s take a ride through their official list of genders.
GENDER IDENTITY (Check all that apply)
Cis-gender woman
Woman
Transgender Woman
Woman of Trans experience
Woman with a history of gender transition
Trans feminine
Feminine-of-center
MTF (male-to-female)
Demigirl
T-girl
Transgirl
Sistergirl
Cis-gender man
Man
Transgender man
Man of Trans experience
Man with a history of gender transition
Trans masculine
Masculine-of-center
FTM (female-to-male)
Demiboy
T-boy
Transguy
Brotherboy
Trans
Transgender
Transsexual
Non-binary
Genderqueer
Agender
Xenogender
Fem
Femme
Butch
Boi
Stud
Aggressive (AG)
Androgyne
Tomboy
Gender outlaw
Gender non-conforming
Gender variant
Gender fluid
Genderfuck
Bi-gender
Multi-gender
Pangender
Gender creative
Gender expansive
Third gender
Neutrois
Omnigender
Polygender
Graygender
Intergender
Maverique
Novigender
Two-spirit
Hijra
Kathoey
Muxe
Khanith/Xanith
X-gender
MTX
FTX
Bakla
Mahu
Fa’afafine
Waria
Palao’ana
Ashtime
Mashoga
Mangaiko
Chibados
Tida wena
Bixa’ah
Alyha
Hwame
Lhamana
Nadleehi
Dilbaa
Winkte
Ninauposkitzipxpe
Machi-embra
Quariwarmi
Chuckchi
Whakawahine
Fakaleiti
Calabai
Calalai
Bissu
Acault
Travesti
Questioning
I don’t use labels
Declined
Not Listed: _________________
Heck, there are only about a hundred “genders” there. That means there shouldn’t be any problem determining which author in this paper is a “Calabai” and which is a “Calalai” …
In addition, the number of authors brings up what I modestly call “Willis’s First Rule Of Authorship”, which states:
Paper Quality ≈ 1 / (Number Of Authors)2
But enough digression … moving on to the paper, there’s a fascinating claim in the abstract, viz:
In 2023, the sea surface temperature (SST) and upper 2000 m ocean heat content (OHC) reached record highs. The 0–2000 m OHC in 2023 exceeded that of 2022 by 15 ± 10 ZJ (1 Zetta Joules = 1021 Joules) (updated IAP/CAS data); 9 ± 5 ZJ (NCEI/NOAA data).
So … what is the relationship between ZJ and the temperature of the top 2000 meters? Let me use the NCEI/NOAA data. Here are the calculations, skip them if you wish, the answer’s at the end. Items marked as [1] are the computer results of the calculation. Everything after a # is a comment.
> (seavolume=volbydepth(2000)) #cubic kilometers
[1] 647,988,372
> (seamass = seavolume * 1e9 * 1e3 * 1.025) # kg
[1] 6.641881e+20
> (specificheat=3850) # joules/kg/°C
[1] 3850
> (zjoulesperdeg=specificheat * seamass / 10e21) #zettajoules/°C, to raise seamass by 1°C
[1] 255.7124
> (zettajoules2023 = 9) # from the paper
[1] 9
> (tempchange2023 =zettajoules2023 / zjoulesperdeg) # °C
[1] 0.035
So all the angst is about a temperature change of thirty-five thousandths of one degree. EVERYONE PANIC!!
But that wasn’t the interesting part. The interesting part is their uncertainty, which per NCEI/NOAA is ± 5 ZJ. Let me note to start that the results of the two groups, IAP/CAS and NCEI/NOAA, differ by 6 ZJ …
Using the above calculations, 5 ZJ is ± 0.019°C … they are seriously claiming that we can measure the temperature of the top 2,000 meters of the ocean to within ±0.019°C.
And how are they doing that?
They say “The main subsurface observing system since 2005 is the profiling floats from the Argo program”. These are amazing floats that sleep a thousand meters down deep in the ocean, then periodically wake up, sink further down to two thousand meters, and then rise slowly to the surface, measuring temperature and salinity along the way. When they reach the surface, they phone home like ET, report the measurements, and sink down a thousand meters to go to sleep again. They’re a fascinating piece of technology. Here’s a map of the float locations from a few years back.
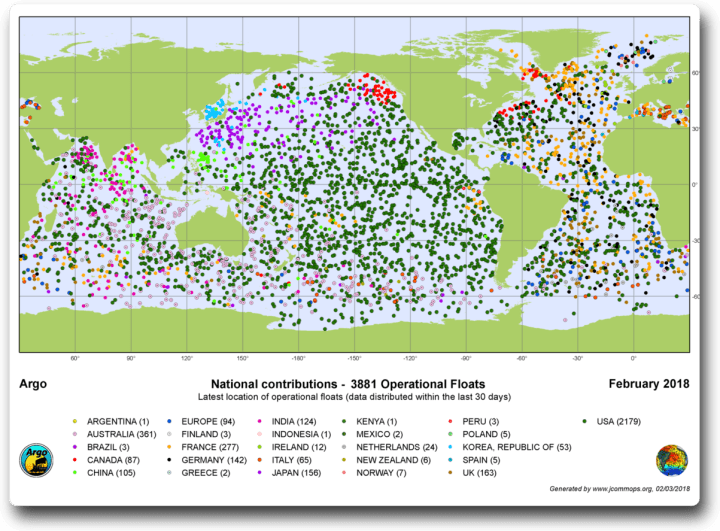
There are about 4,000 floats, each of which measures the temperature as it rises from 2000 meters up to the surface every 10 days. Note that they tend to concentrate in some areas, like the intertropical convergence zone by the Equator and the US East Coast, while other areas are undersampled.
So to start with, ignoring the uneven sampling. each float is theoretically representative of an area of about 92,000 square kilometers and down to two kilometers depth. That’s a bit more area than Austria, Portugal, or the state of South Carolina.
Now consider their claim for a moment. We put one single thermometer in Austria, take one measurement every 10 days for a year … and claim we’ve measured Austria’s annual average temperature with an uncertainty of ±0.019°C???
Yeah … that’s totally legit …
But wait, as they say on TV, there’s more. That’s just measuring the surface temperature, but the Argo floats are measuring a 3D volume, not the surface. So their claimed uncertainty is even less likely.
Here’s another way to look at it. We’re talking about the uncertainty of the average of a number of measurements. As we get more measurements, our uncertainty decreases … but it doesn’t decrease directly proportionally to the number of measurements.
Instead, it decreases proportionally to the square root of the number of measurements. This means if we want to decrease the uncertainty by one decimal point, that is to say we want to have one-tenth of the uncertainty, we need one hundred times as many measurements.
And of course, this works in reverse as well. If we have one-hundredth of the number of measurements, we lose one decimal point in the uncertainty.
So let’s apply that to the ARGO floats.
Claimed uncertainty with 4,000 floats = ± 0.019°C
Therefore, uncertainty with 40 floats = ± 0.19°C
And uncertainty with 4 floats = ±0.19 time the square root of 10 = 0.6°C …
Their claimed uncertainty says that four ARGO floats could measure the temperature of the entire global ocean to an uncertainty of less than one degree … yeah, right.
Sadly, I fear that’s as far as I got in their paper … I was laughing too hard to continue. I’m sure it’s all sciency and everything, but they lost me by hyperventilating over an ocean warming of thirty-five thousandths of a degree and put me over the edge by claiming an impossibly small uncertainty.
Here, a sunny morning in the redwood forest after a day of strong rain, with football playoffs (not the round ball kind) starting in a little while—what’s not to like?
My very best to all,
w.
[ADDENDUM] To close the circle, let me do a sensitivity analysis. The paper mentions that there are some other data sources for the analysis like XBTs (expendable bathythermographs) and other ship-deployed instruments.
So let’s assume that there were a further 4,000 scientific research vessels who each made a voyage where they made thirty-six XBT measurements. That would double the total number of measurements taken during the year. Never mind that there aren’t 4,000 scientific research vessels, this is a sensitivity analysis.
That would change the calculations as follows:
Claimed uncertainty with 8,000 floats + measurements = ± 0.019°C
Therefore, uncertainty with 80 floats + measurements = ± 0.19°C
And uncertainty with 8 floats + measurements = ±0.19 time the square root of 10 = 0.6°C …
We come to the same problem. There’s no way that 8 thermometers taking temperatures every 10 days can give us the average temperature of the top two kilometers of the entire global ocean with an uncertainty of less than 1·°C.
MY USUAL: When you comment please quote the exact words you are discussing. It avoids endless misunderstandings.