


Energy Cable: How solid is the Nat Gas bull case here?
As European gas prices post a weekly jump due to Ukraine giving Putin his very own "Operation Citadel" moment, we delve into the data. Is this Nat Gas rally solely a supply story?

Energy Cable: How solid is the Nat Gas bull case here?
As European gas prices post a weekly jump due to Ukraine giving Putin his very own "Operation Citadel" moment, we delve into the data. Is this Nat Gas rally solely a supply story?
AUG 12
∙
PREVIEW


Take aways:
Norwegian maintenance season and no flows from Russia is a spicy mix
Temperature is the main factor for worries about stock levels
2022 mayhem may be closer than you think
Refiners’ capacity utilization weak causing fear of crude gluts
Hello from Copenhagen.
Fears in natural gas markets have returned as Ukrainian troops are giving Putin his own “Operation Citadel” moment. While many European countries have sought alternatives to Russian gas, nations like Austria and Slovakia still depend on it. Currently the attacks on Sudzha have caused flows into Ukraine to drop by 50 GWh/Day representing less than 1% of total inflows into the EU.
There is of course the chance that the attack will speed up the end of the “Brotherhood pipeline”, which in case will see Europe wave goodbye to inflow totaling around 6.6% of the total flows. If you couple that with the Norwegian maintenance season things could get spicy.
Given that Ukraine’s gas transmission operator, LLC Gas TSO, does not wish to extend Russian gas transport beyond 2024, there lie even greater catalysts for fears 6-8 months in the future, assuming the Brotherhood line isn’t closed preemptively.
Chart 1.a: Steady flows to Europe for much of the time

Chart 1.b: Around 0.6% of European flows have currently been cut off

Apart from inflows, a key contributor to the robust natural gas storage levels in Europe has been the two mild winters of 2023 and 2024, which allowed us to consume about 12.5% of our stock level weekly.
When comparing 2024 with 2021, we see the impact that 7 weeks of below-average temperatures can have on stock levels, with week 8 of 2021 reaching 30% consumption. Right now, the robust stock levels in Europe will dampen some fears in the market, but that could change with one bad winter.
Chart 2.a: Large and prolonged temperature abnormalities cause sever storage withdrawal
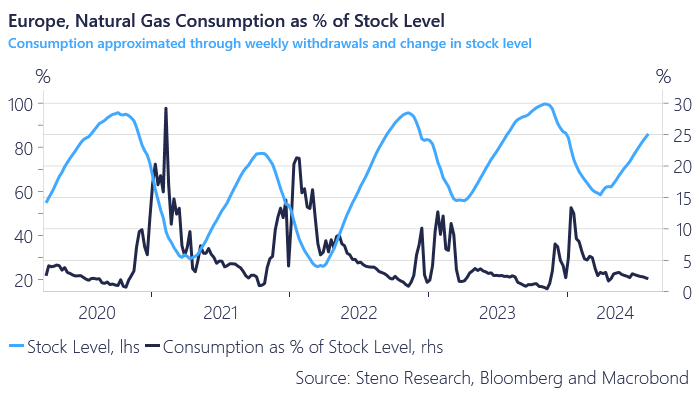
Chart 2.b: 7 weeks of below mean temperatures in Jan/Feb of 2021 really hurt. Imagine that today…

We often hear that Europeans have been excellent at reducing natural gas consumption over the past two years. Analyzing the rolling coefficient of temperature in Middle Europe against our consumption proxy, we find that a 1-degree increase in temperature currently aligns with pre-COVID times, indicating that consumption isn’t very elastic—again underscoring our good fortune over the last two winters.
The 2022 mayhem in gas markets may be closer than you think with just a few key ingredients needed, like a cold winter, some supply troubles and speculators pilling in.
Chart 3: The main driver for consumption is temperatures

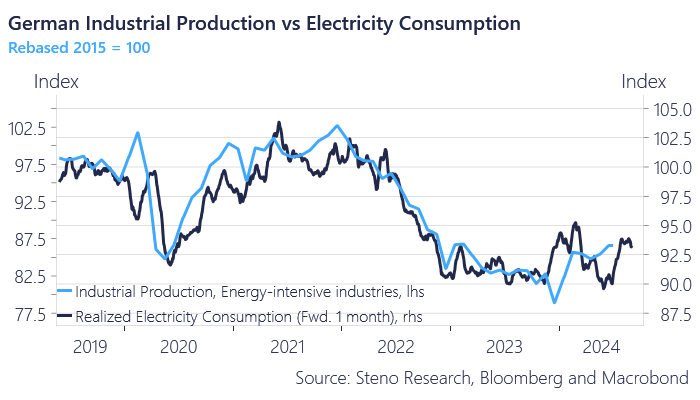
Finally, manufacturing in Europe is still not providing any significant tailwinds for TTF long positions. Consider the industrial production of energy-intensive industries in Germany, which has yet to fully recover from the energy crisis.
Moreover, manufacturing sectors, unlike households, can adjust their natural gas consumption more flexibly. Therefore, when input costs rise, they scale down production. We need energy prices and volatility in Europe to stabilize for the manufacturing sector to become a factor.
Chart 4: German energy intensive IP still haven't recovered from the energy crisis
Although additions to stock levels in the US have been flat-ish over the last weeks they are still strong compared to historic data.
The strength is partly due to the all-time highs in US shale productionof which natural gas is a byproduct and the lack of appetite for US LNG around the globe due to strong storage levels.
When crude production is strong and appetite for LNG low, then gas gluts in the US cause prices to fall from the sky. Whereas manufacturing in Europe looks sluggish the business cycle looks far more healthy in the US leading us to be more bullish Henry Hub.
Chart 5.a: Stock levels in the US also look seasonally strong

Chart 5.b: Henry Hub bulls need the rest of the world to start buying more gas

The relationship between WTI and Henry Hub, as previously mentioned, creates a dynamic where higher crude prices prompt producers to increase crude output, which in turn floods the market with gas as operations become increasingly gassier.
From a positioning perspective among managed money, this negative relationship is evident. When speculators pile into WTI, they scale down their Henry Hub bets. Therefore, looking strictly at positioning, lower crude prices correspond to higher natural gas prices.
Furthermore, oil refiners in the U.S. are slowing down, according to BBG, stoking concerns about crude gluts. As shown in Chart 6.b, seasonal capacity utilization is very weak compared to historical data, indicating a bleak outlook for crude...