


Global Historical Hurricane & Cyclone Statistics Establish that 2023 Experienced a Very “Normal Year.”

Global Historical Hurricane & Cyclone Statistics Establish that 2023 Experienced a Very “Normal Year.”
Global Historical Hurricane & Cyclone Statistics Establish that 2023 Experienced a Very “Normal Year.”
Guest essay by Larry Hamlin
NOAA concocted an array of “Selected Significant Climate Anomalies and Events” for year 2023 that are shown below as prominently featured in their Annual 2023 Global Climate Report.
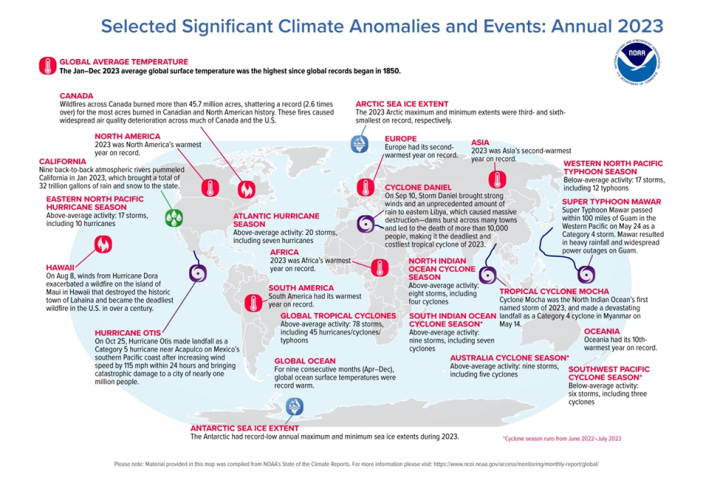
Of the 25 highlighted entries on NOAA’s “Selected Significant Climate Events” diagram 13 are related to cyclone and hurricane events across the various oceans of the Northern and Southern hemispheres that occurred during the year 2023.
These 13 highlighted isolated events suggest that 2023 experienced many extreme weather hurricane and cyclone events that will no doubt be hyped by climate alarmists with flawed claims of “extreme hurricane and cyclone climate events” having occurred in year 2023.
However, the context of these highlighted events fails to provide a complete and comprehensive global history of the cyclone and hurricane tropical events for the year 2023 with these NOAA highlighted events grossly misrepresenting the totality of the year 2023 cyclone and hurricane outcomes across the global oceans.
Provided below is data from the Colorado State University Department of Atmospheric Science Tropical Meteorology Project that addresses in full and complete detail (access the Basin Archives global oceans data base) the historical tropical cyclone statistics for year 2023 across all the global oceans along with comparisons provided of the year 2023 outcomes with prior decades of recorded annual hurricane and cyclone data.
The graphs below reflect data regarding the Accumulated Cyclone Energy (ACE) for each year indicated with this metric representing the complete annual energy resulting from all storms experienced with the total duration and intensity determining each storm’s total ACE contribution.
The first graph provides the year 2023 Global historical cyclone ACE outcome compared to ACE data for the last 44-year inclusive period going back to 1980.
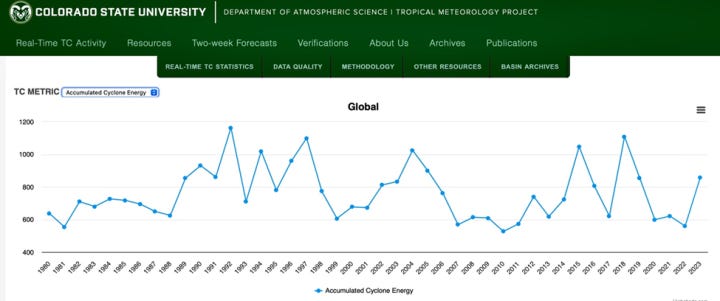
The data demonstrates no consistent increasing trend of ACE during this period with the year 2023 representing only the 10th highest ACE during this period.
The next graph provides the year 2023 Northern Hemisphere ACE outcome compared to ACE data for each year going back the last 53 years to 1971.
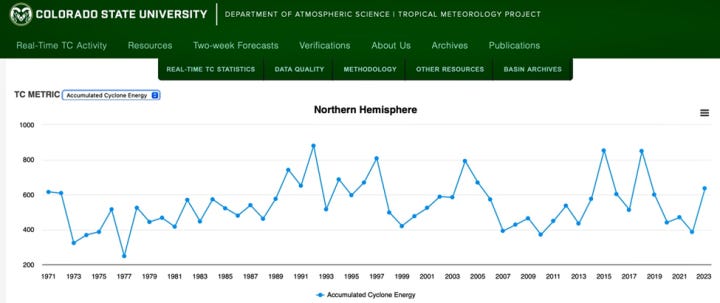
The data demonstrates no consistent increasing trend of ACE during this period with the year 2023 representing only the 11th highest ACE during this period.
The next graph provides the year 2023 Southern Hemisphere ACE outcome compared to ACE data for each year going back the last 44 years to 1980.
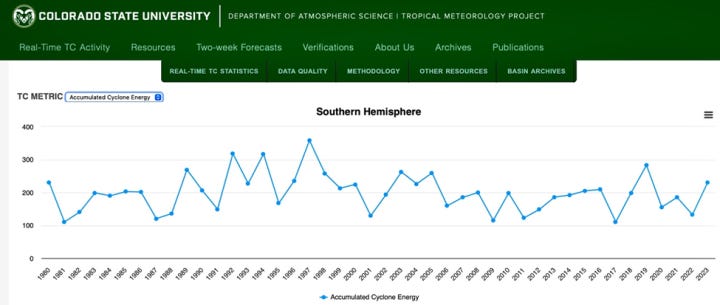
The data demonstrates no consistent increasing trend of ACE during this period with the year 2023 representing only the 15th highest ACE during this period.
The next 2 graphs provide the year 2023 Northeast and Northwest Pacific Ocean ACE outcomes compared to ACE data for each year going back the last 53 and 74 years respectively to 1971 and 1950.

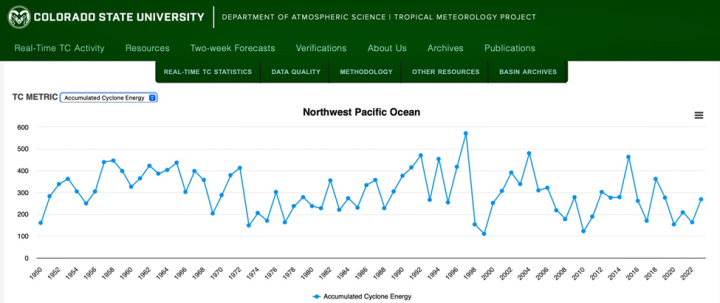
The data demonstrates no consistent increasing trend of ACE during these periods with the year 2023 representing only the 14th and 22nd highest ACE during these periods.
One of the NOAA “Selected Significant Climate Events” includes a flawed claim that “Hurricane Dora (located in the Northwest Pacific Ocean) exacerbated a wildfire on the island of Maui in Hawaii that destroyed the historic town of Lahaina.”
This claim is completely false as addressed here and here.
Hurricane Dora was located 700 miles south of Maui and played no significant role in the fire.
The massive fire was the direct result of incompetence by Hawaiian Electric which delayed for years $190 million dollars of planned and required maintenance on known distribution and transmission line defects (it spent only $250,000 on these projects) while spending tens of millions on increasing nondispatchable unreliable solar and wind projects dictated by renewable energy activist politics.
The next graph presents the year 2023 South Pacific Ocean ACE outcome compared to ACE data for each year going back the last 44 years to 1980.
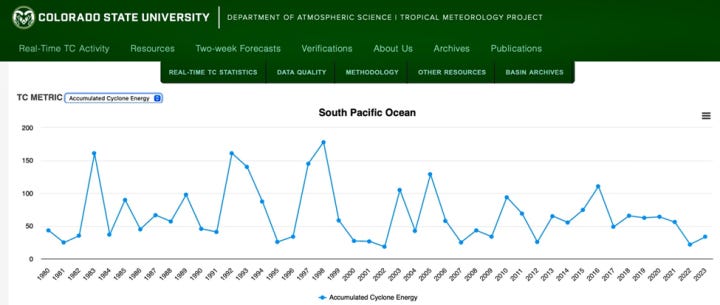
The data demonstrates no consistent increasing trend of ACE during this period with the year 2023 representing only the 33rd highest ACE during this period.
The next 2 graphs present the year 2023 North and South Indian Ocean ACE outcomes compared to ACE data for each year going back the last 52 and 44 years respectively to 1972 and 1980.

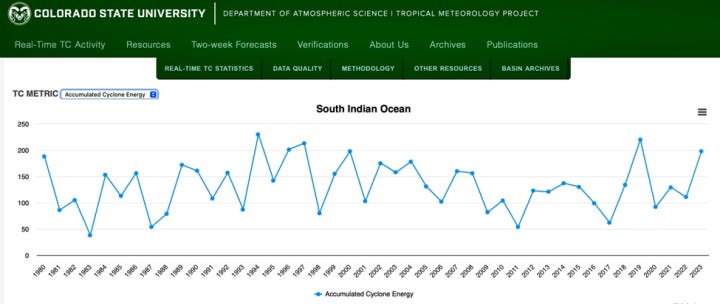
The data indicate a recent increasing trend in the North Indian Ocean and no consistent increasing trend in the South Indian Ocean with the year 2023 ACE being 2nd highest in the North Indian Ocean and 5th highest in the South Indian Ocean during these respective periods.
The next graph presents the year 2023 North Atlantic Ocean ACE outcome compared to ACE data for each year going back the last 173 years to 1851.
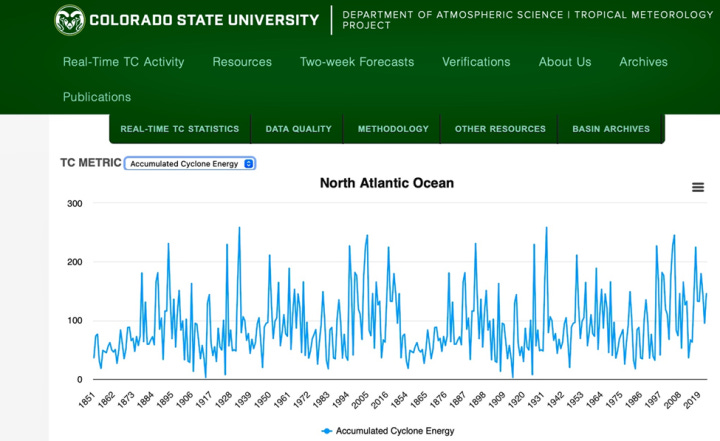
The data demonstrates no consistent increasing trend of ACE during this period with the year 2023 representing only the 33rd highest ACE during this period.
Furthermore, there was only 1 landfalling North Atlantic major hurricane that struck the U.S. in 2023 as shown below and addressed here.

The data shows there is no increasing trend of landfalling major hurricanes on the Continental U.S. from North Atlantic major hurricanes during the period from 1900 through 2023.
Unlike the NOAA year 2023 concocted and prominently featured “Selected Significant Climate Events” diagram which falsely hypes the extent of the year 2023 global hurricane and cyclone season outcomes the data from the State University of Colorado Tropical Meteorology Project clearly establishes that the year 2023 was a very unremarkable and “normal” year for cyclones and hurricanes across the globe.
Climate alarmist claims that hype the year 2023 hurricane and cyclone season as being an “extreme weather outcome” are absurd and incompetent as is NOAA’s “Selected Significant Climate Events” hurricane diagram portrayal.