
“The Myth of Ever-Escalating Climate Costs in the USA. What the Numbers Really Show”, DR. MATTHEW WIELICKI
“I’ve taken the opportunity to update the numbers through 2023 (found here: https://www.weather.gov/media/hazstat/sum23.pdf) to see whether any newly emerging trends might confirm alarmist storyline.

The Myth of Ever-Escalating Climate Costs in the USA
What the Numbers Really Show
JAN 7
∙
PAI

D


Over the past several years, I have published multiple articles questioning the dominant narrative that every weather disaster is clear-cut evidence of galloping climate costs. In these pieces, I analyzed the mismatch between frightening media forecasts and actual, inflation-adjusted damage data. Time after time, the results contradicted the notion of an inexorable upward march in losses. Now, with 2024 figures still forthcoming, I’ve taken the opportunity to update the numbers through 2023 (found here: https://www.weather.gov/media/hazstat/sum23.pdf) to see whether any newly emerging trends might confirm the alarmist storyline.
What emerges from this updated dataset is that while certain weather events (like wildfires or hurricanes) can cause large spikes in damage during specific years, there is no consistent, compounding increase that lines up with the idea of an unavoidable climate apocalypse. Natural variability, land-use decisions, and policy choices appear to shape the data far more than a simple correlation with rising greenhouse gas (GHG) concentrations. Indeed, the year-to-year damage graphs look remarkably jagged, and the patterns they form make it increasingly difficult to insist that every type of weather event grows worse by default.
Lightning: Where’s the Ever-Rising Danger?
One of the frequently repeated claims in the media is that lightning damage will intensify alongside a warming atmosphere, with pundits citing warmer temperatures that supposedly breed more thunderstorms and, by extension, more lightning strikes. Figure 1 tracks lightning-related damage from 2012 to 2023 (in millions, adjusted to 2023 dollars), and the results show anything but a tidy, ascending line. In some years, costs are comparatively high due to either more numerous strikes or concentrated damage in populated areas, but other years see a noticeable dip.
Despite bold predictions, often from climate commentators featured prominently in mainstream outlets, about an inevitable surge in lightning-inflicted property loss, the data reveal a series of rises and falls rather than a straightforward escalation. It’s important to remember that changing demographics also matter: if more people and businesses occupy lightning-prone regions, even a normal thunderstorm season might impose higher absolute damage costs. However, these nuances seldom appear in dramatic headlines claiming that lightning alone will become an ever-growing menace.

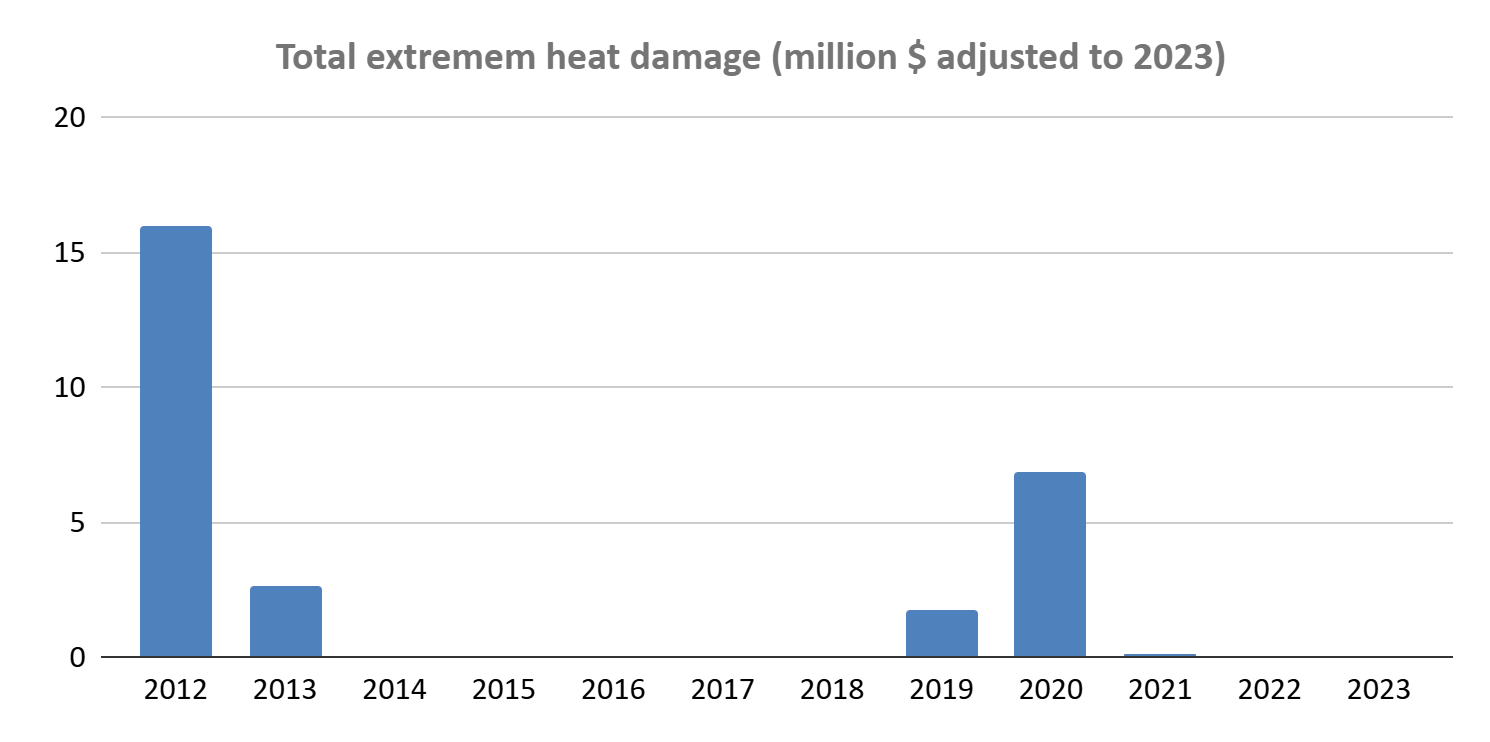
Extreme Heat: Apocalyptic Claims vs. Reality
Few weather phenomena have been used to sell the climate crisis quite like extreme heat. Media reports often feature vivid language about “unprecedented heat waves” or “deadly temperature extremes” that supposedly represent a harbinger of our collective doom. Figure 2, which captures damage costs attributable to extreme heat, shows occasional spikes, particularly in years when big heat waves hit major agricultural areas or urban centers not fully prepared.
Yet, as pronounced as these spikes may be, they do not unfold in a smooth, alarming upward trajectory. Instead, the numbers swing up and down. High-profile commentators, such as Michael E. Mann, have reiterated the claim that “extreme heat events are becoming more intense, more frequent, and more expensive.” While it is certainly plausible that heat waves could become more intense under climate change, these data do not confirm an unrelenting escalation in the associated damages. Rather, the chart underscores that individual seasons can be harsher for a variety of reasons, ranging from atmospheric variability to how cities implement cooling measures, without spelling out a linear crisis.
Tornadoes: The Great Twister Panic
Tornadoes frequently occupy a central place in discussions of extreme weather costs, with public figures like Al Gore warning that more warming would yield more destructive twister outbreaks. Figure 3, however, reveals a pattern closer to a roller coaster than a steady climb. One or two years might stand out with especially high costs tied to major outbreaks hitting densely populated regions, yet the following seasons could be relatively calm, driving overall damages back down.
This cyclical or oscillating behavior suggests that short-term meteorological dynamics, and perhaps luck regarding where tornadoes touch down, matter more than a sweeping, single-factor explanation like “global warming makes everything worse.” If tornado damage was truly in lockstep with rising carbon dioxide levels, we would expect the chart to exhibit a consistent climb rather than the sporadic peaks and valleys it currently displays. From a policy perspective, this inconsistency raises questions about how much weight should be placed on dire tornado predictions when setting insurance rates or directing funding toward disaster mitigation.

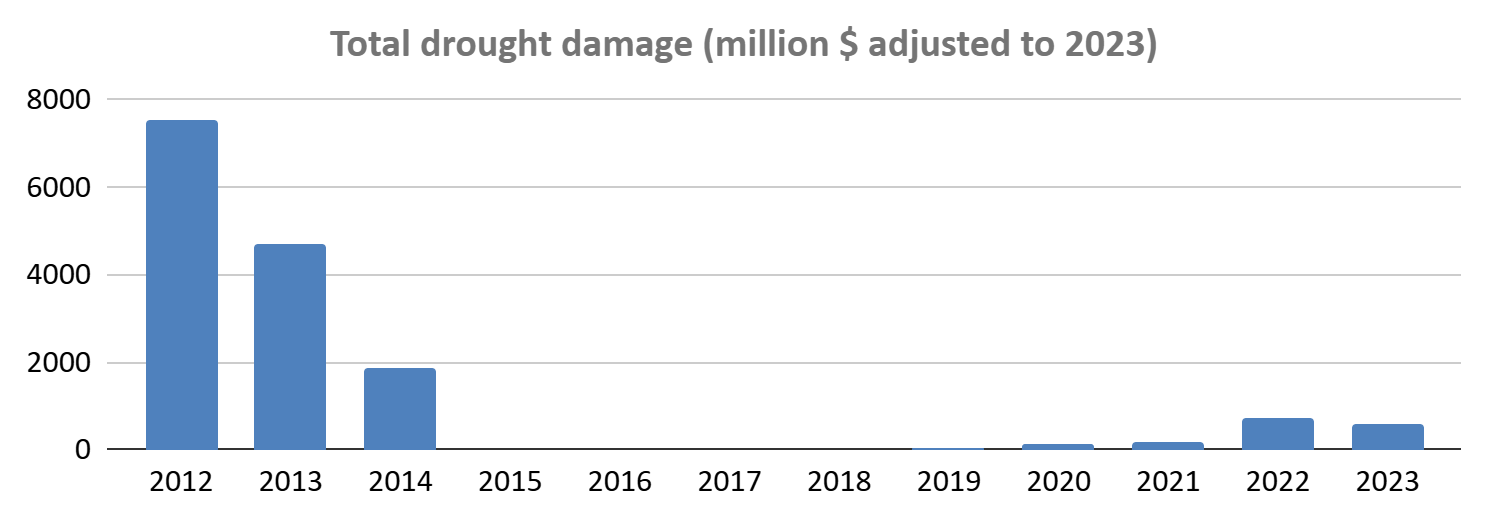
Drought: The Myth of Endless Megadroughts
Drought remains another go-to subject for climate-alarm headlines, with phrases like “historic megadrought” and “no relief in sight” commonly sprinkled into stories. Yet Figure 4, which lays out drought-related damage from 2012 to 2023, undercuts the widespread assumption that each passing year will necessarily bring escalating dryness and agricultural devastation. The data certainly show certain years, especially in the early part of this timeframe, with glaringly high losses, often tied to severe impacts on farming.
However, those extreme years do not repeat in a straightforward fashion, and subsequent seasons record relatively modest drought costs. This is not to deny that certain regions can experience tough, prolonged droughts, but it does refute the narrative that the cost simply rises in tandem with the planet’s temperature. Additionally, improved water management policies, shifts in crop selection, and even changing precipitation patterns can mitigate the financial toll, reminding us that real-world outcomes result from far more than climate alone.
Thunderstorm Wind: Claims of Supercells Everywhere
Thunderstorm wind damage often makes headlines for ripping roofs off homes and snapping trees. Climate alarmists have occasionally cited a projected increase in supercell thunderstorms as evidence that property destruction from straight-line winds must be on an up-and-up trajectory. Figure 5, which tallies thunderstorm wind losses for the 2012–2023 period, displays the same non-linear story: a few big seasons cause prominent spikes, while quieter years show minimal damage.
That seesaw effect is driven by complex atmospheric conditions, the location of severe storms, and even local preparedness measures. If building standards improve in storm-prone areas, or if fewer storms track over densely populated suburbs, the damage total can drop markedly, regardless of global temperature fluctuations. These specifics are often ignored when broadcast news frames every thunderstorm as evidence of a gathering climate “catastrophe.”

Hail Damage: Bigger Storms—But Where’s the Trend?
Hailstorms, with their capacity to shatter windows, dent vehicles, and pulverize crops, are another staple in climate scare stories. Some experts claim that “hailstones are bound to get bigger” as the atmosphere holds more moisture and energy. Yet Figure 6, charting hail-related damage, moves unevenly over the past decade. One or two years, such as 2016, do see a notable leap in costs, but subsequent seasons often register levels far below that, contradicting the sense that hail losses should escalate year after year.
As with other event types, numerous variables besides average global temperature come into play—most notably, where population and businesses expand. If a once-rural region becomes home to major commercial developments, even moderate hailstorms can produce large absolute damage totals. This factor can cause spikes that are wrongly interpreted as proof of climate-driven extremes.

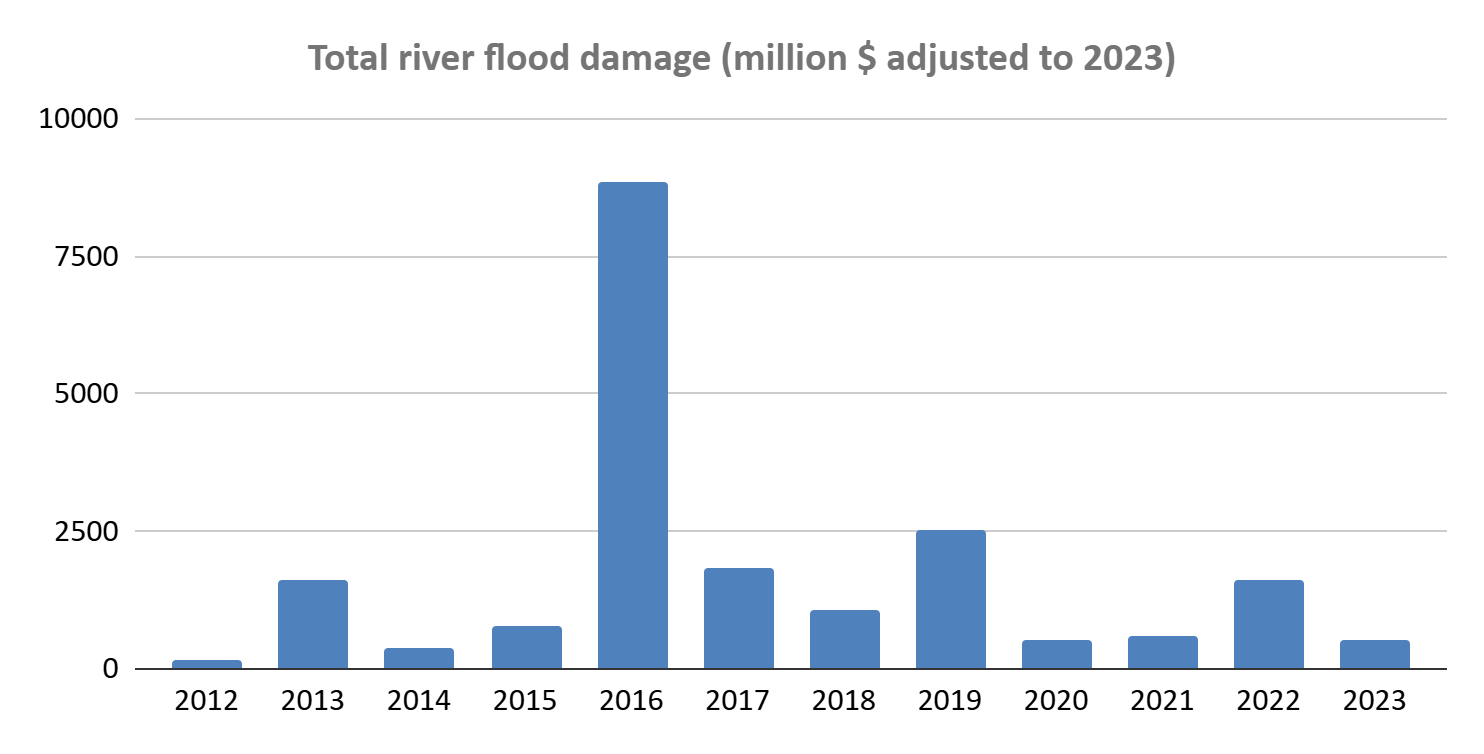
River Flooding: That “Waterworld” Never Came
Predictions of ever-rising flood levels frequently dominate discussions around sea-level rise and extreme precipitation events, with some publications suggesting entire regions face inevitable submersion. While coastal flooding is a separate issue, river flooding has also been framed in dire terms, with warnings that inland areas will suffer repetitive, catastrophic inundations. Figure 7 depicts total damage from river flooding, and aside from a dramatic peak in 2016—which can be traced to a series of exceptionally costly flood events—the other years are comparatively tame.
This disparity hardly fits the storyline that “we’re all going underwater” any day now. Could flood damage still rise in the future? Of course, especially if communities continue building heavily in floodplains without investing in robust infrastructure. But the numbers from 2012 to 2023 undercut the notion that floods are becoming unmanageable as a direct, uniform result of climate change. Instead, it appears that specific local factors—like rainfall patterns, zoning decisions, and emergency preparedness—ultimately govern how costly flood events turn out to be.
Surely after the events of Hurricane Helene these numbers will go up in 2024.
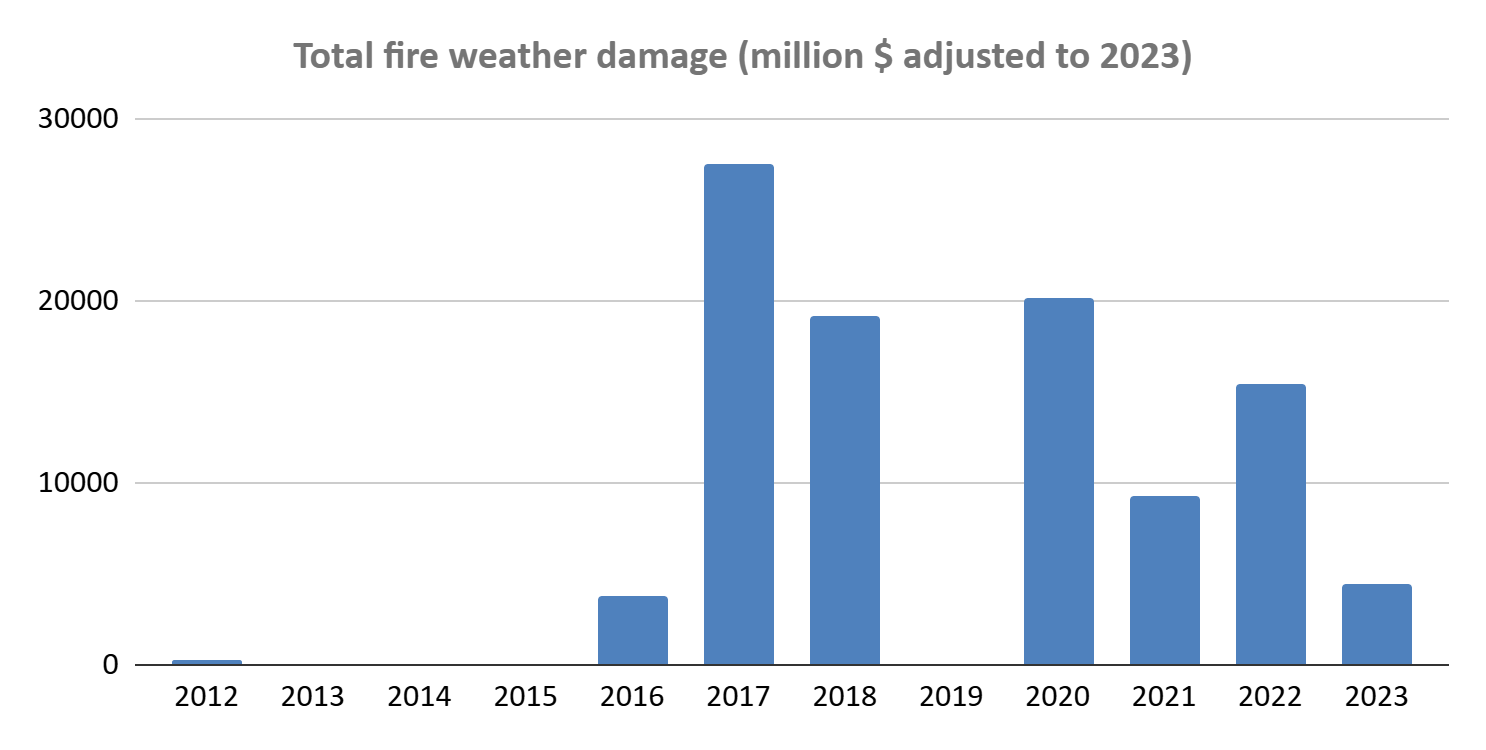
Fire Weather: Poster Child for Alarm
In the public imagination, wildfires have become nearly synonymous with climate change. Scenes of blazing hillsides and destroyed neighborhoods feature prominently in documentaries, news broadcasts, and political speeches. Figure 8 does show a couple of notoriously costly periods, most notably in 2017 and 2018, when huge blazes in parts of the West grabbed global attention. Prominent figures like James Hansen declared these events a foretaste of the “inevitable outcome” of our current emissions trajectory.
Yet beyond those standout years, the data do not form a neat, unbroken rise. Instead, fire weather losses remain volatile, with some seasons far less expensive despite ongoing warnings that wildfires “will only get worse.” Moreover, where people choose to build houses and how forests are managed can greatly influence total damage. This reminds us that while climate conditions can contribute, policy decisions around land use, controlled burns, and infrastructure resilience tend to determine whether a fire stays a remote ecological event or becomes a multi-billion-dollar disaster.
All Weather Damage: Follow the Money, Not the Hype
Bringing all these categories together in Figure 9 demonstrates the same fundamental pattern that each type of event reveals on its own: no consistent upward trend signals a universal and inevitable explosion in weather-related costs. Instead, the aggregated line bobs up and down, largely influenced by one or two major disasters in some years—and often dipping significantly in others. This is inconsistent with the claim that greenhouse gas-induced warming is categorically sending damage totals higher every year without fail.
Crucially, these data reinforce the conclusions from my previous articles: when you go beyond sensational headlines and dig into actual, inflation-adjusted numbers, the storyline of unstoppable, ever-growing climate destruction appears deeply flawed. That’s not to say climate change has zero impact, but attributing every bump in damage solely to a warmer world ignores a complex array of factors, including how we develop vulnerable regions, shifts in insurance markets, and random year-to-year weather variability. Until the 2024 data are released, we will have to wait to see whether any new evidence emerges to support or refute this narrative further. For now, the most striking revelation is that the breathless coverage and rampant claims of permanent crisis remain at odds with the empirical record—which suggests we may be looking more at a case of profitable alarmism than a simple, data-driven conclusion about our climate.

Conclusion
Taken together, these updated figures through 2023 reinforce a central theme that has run through my past articles: while no one denies that extreme weather can wreak havoc, or that a changing climate may influence certain events, the data simply do not point to a runaway, ever-escalating crisis. Instead, year-to-year damage totals fluctuate dramatically, driven by factors such as land use, where and how we build, the vagaries of short-term weather patterns, and decisions around infrastructure and preparedness. A massive disaster in one year can fuel headlines of an impending apocalypse, only for the subsequent period to remain comparatively calm.
By looking at these inflation-adjusted numbers, it becomes clear that the popular storyline—“Every weather event is worse because of rising greenhouse gases”—lacks solid empirical backing. What the charts really show is a pattern of oscillations rather than a neat, upward trend consistent with claims of a climate-fueled catastrophe. Certainly, the planet is warming; certainly, weather is changing. But the reflexive urge to blame every spike in damages on climate change overlooks a host of more immediate drivers, including regional development decisions and the core variability that has always characterized the weather.
The frequent mismatch between alarmist forecasts and the observed data raises difficult questions: To what extent is the public being misled by sensational media reports, and who benefits from the perception of a never-ending crisis? If a single disastrous season is all it takes to generate calls for sweeping policy changes or insurance rate hikes, then there’s a risk that well-intentioned concern morphs into a money-making opportunity for certain industries and political interests.
Until the 2024 figures are published, the best course is to continue following the evidence, and that evidence currently points to a far more nuanced picture than the simplistic narrative of accelerating, all-encompassing climate catastrophe.