

What is WBGT ?
Guest Essay by Kip Hansen — 10 September 2023
Despite recent findings that unusually cold temperatures cause far more deaths than unusually warm temperatures, The Washington Post and an outfit called CarbonPlan have launched a project that: “used new models and massive data sets to produce the most up-to-date predictions of how often people in nearly 15,500 cities would face such intense heat that they could quickly become ill — in the near-term and over the coming decades. The analysis is based on a measure called wet-bulb globe temperature (WBGT), which takes into account air temperature, humidity, radiation and wind speed, and is increasingly used by scientists to determine how heat stresses the human body.” [ source ]
The Washington Post piece uses Pakistan and its “hottest place on Earth” as the poster child-like example for how climate alarmists think that extremely high temperatures caused by “climate change” will “kill kill kill” [h/t Alice’s Restaurant Massacree by Arlo Guthrie]. Of course, the Post perpetuates the disinformation that 1/3 of Pakistan was underwater [ and here ] from flooding in 2022, with the reality having been around 8-10% at the highest water levels, which quickly receded in most places. Of course, the flooding caused by the extra-strong 2022 Monsoon Rains overwhelmed the nascent flood control efforts of Pakistan, which is a very poor country with infrastructure still fighting its way out of the “primitive” classification. It was a true disaster for the people of Pakistan some who are still struggling to recover.
But it is not the heat that is killing the rural poor in Pakistan, it is the diseases that come from and with poverty and lack of health care infrastructure.
Of course, with large areas left with stagnant ponds and puddles, malaria ramped up as it does every monsoon, but more so. The flooding had nothing to do with “climate change” – it was a fairly common stronger monsoon but with even more rain. These stronger monsoons predictably cause flooding in Pakistan – and there were massive floods in 1950, 1992, 1993, 2010, and 2022. The cause of the flooding, according to a recent paper in Nature-Scientific Reports: “In August 2022, one of the most severe floods in the history of Pakistan was triggered due to the exceptionally high monsoon rainfall.”
The more interesting thing that comes up in this Washington Post article is that: “To document one of the most widespread threats — extreme heat — The Post and CarbonPlan, a nonprofit that develops publicly available climate data, used new models and massive data sets to produce the most up-to-date predictions of how often people in nearly 15,500 cities would face such intense heat that they could quickly become ill — in the near-term and over the coming decades. The analysis is based on a measure called wet-bulb globe temperature (WBGT), which takes into account air temperature, humidity, radiation and wind speed, and is increasingly used by scientists to determine how heat stresses the human body.”
The Post defined its dangerous heat threshold as more than 89.6°F wet-bulb globe temperature, claiming that this was equal to a temperature of 120 degrees on a dry day, or mid-90s temperature on a very humid day. A WBGT over 89.6°F is the level at which there should be no strenuous outside work or exercise in the direct Sun, with the “flag” system, that index rating is Black Flagged by most organizations (see the charts far below). But, this is how this 70-year-old index will be misused to create and spread fear and panic about “global warming” – making direct comparisons between the WBGT Index and Thermometer Temperatures, using an unfamiliar index value that is little understood by the public, and computationally inventing future WBGT readings.
In order to show why this effort to create wide -area of global maps of future WBGT is simply impossible, I’ll have to explain what WBGT is when it leaps out of bed in the morning.
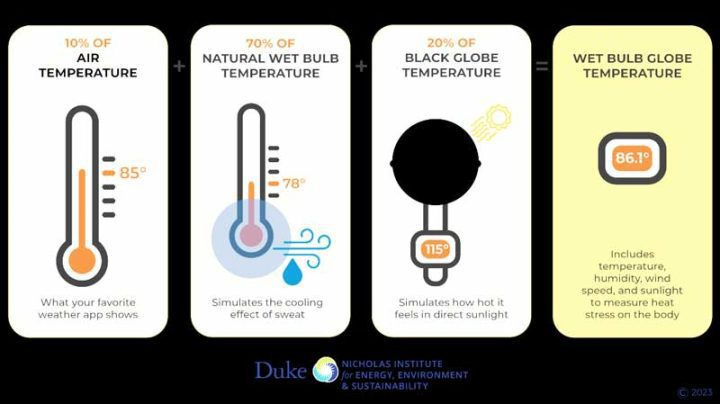
So, what exactly is Wet-Bulb Globe Temperature? “The wet-bulb globe temperature (WBGT) is a type of apparent temperature used to estimate the effect of temperature, humidity, wind speed (wind chill), and visible and infrared radiation (usually sunlight) on humans.” This “apparent temperature” (calculated in F or C) is not a temperature at all, but rather just a value – a number – an index — that can be shown as a scale and given as a scale of potential heat stress that might be experienced in direct Sun and strenuous human activity — think, construction work, agricultural laborers or a high school sports team during afternoon football or soccer practice. This index was originally developed in the 1950s by the U.S. military to reduce heat stress deaths during military training exercises. WBGT is intended to be used as a guide to managing workload stress in direct sunlight. Another version of WBGT can be used indoors by ignoring some of the elements used to calculate it (wind speed, and “visible and infrared radiation (usually sunlight).”
The problem then became: ”However, recently the National Weather Service (NWS) was asked to provide the WBGT using only data that is routinely collected by the NWS. The main problem with this is that one of the variables in the equation to calculate WBGT is the “globe temperature.” This temperature is found by using a copper globe painted in black matte paint with a thermometer inserted so that the bulb is in the center of the globe. This temperature is not routinely collected by the NWS.” To overcome this problem: “This paper shows how the globe temperature can be approximated using only data routinely collected by the NWS. A fourth degree polynomial equation is derived for globe temperature with the coefficients dependent on readily available data. Then, it is shown that the fourth-degree polynomial can be reasonably approximated by a linear equation, thus making computation less costly and time-consuming.”
Here, like many other calculated metrics, there is some unfortunate naming. Let’s look at the name: Wet-Bulb Globe Temperature.
Wet-Bulb: refers to “wet-blub temperature”, one of the inputs into the formula for determining WBGT. This is an actual temperature measurement, in degrees, F or C.
Globe Temperature: This is more correctly “black globe temperature”. “Black globe temperature is measured with a thermometer inside a black globe, which indicates how hot it feels in direct sunlight.” [ source ] This is also an actual temperature measurement, in degrees, F or C, albeit inside of a black painted metal globe. It is used as a substitute for direct measurement of “visible and infrared radiation (usually sunlight)”.
However, WetBulb Globe Temperature (WGBT) is not a temperature at all – the words “global” and “temperature” are together as “globe temperature” – and the whole aconymed down to Wet Bulb Globe Temperature thus to WGBT — however, WBGT is an index. Just a number that can be compared only to other numbers of the same index. It is not a measure of sensible heat. When the WBGT is reported, it is given in WBGT(F) or WBGT(C), like this “86.7˚F” which looks like, but is not, a temperature. The “˚F” means nothing more than the WBGT was calculated using degrees Fahrenheit. (similarly for ˚C).
To accurately measure the WBGT index for a particular place and time, one needs a set-up something like the one below, which is, if you look closely, two or three systems being compared:
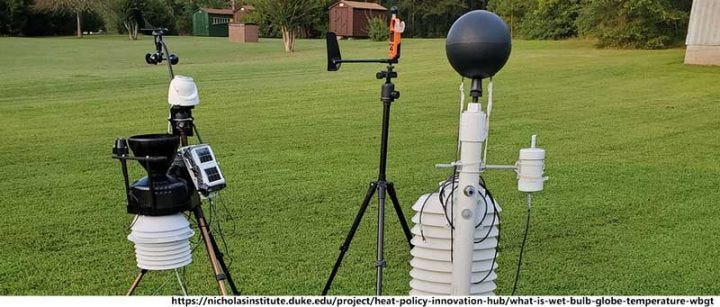
On the mic-stand (middle) is a stand-alone Kestrel 5400 WBGT meter couple with a wind vane to turn the anemometer to the wind. The Kestrel system approximates the WBGT closely enough for safety purposes. We can see (mostly) the needed elements: air temperature, humidity (directly or via a wet bulb thermometer), radiation (black globe) and wind speed.
Just yesterday, I demonstrated the principles of WBGT to myself (I took time off from this research project to help my son paint a local widow’s concrete front porch on a 90°F day, in the hot direct sun.) It is very humid where I live, with the relative humidity over 90% almost every day during the summer. If I stood in the sun near the garage, even with its door open to prevent reflected solar radiation, I quickly became overheated. If I moved just 20 feet down the driveway, where a gentle breeze was blowing up the street, I immediately felt cooler, felt comfortable. This is why wind speed is included in the full WBGT calculation. This practical experiment convinced me of the validity of the WBGT index and also that WBGT is extremely dependent on specific very-local conditions – local within feet or yards/meters, but not kilometers or miles, not degrees of longitude and latitude.
Here are scales from weather.gov, with their flag colors:
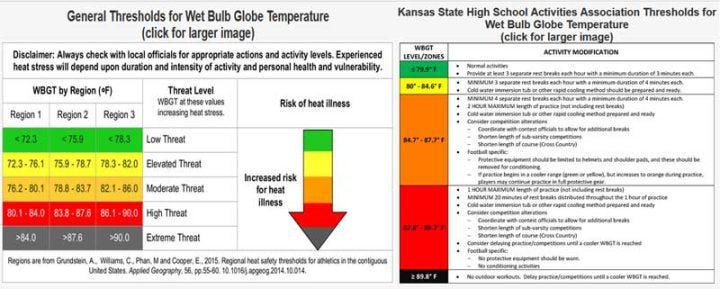
[ Open larger image in new tab ]
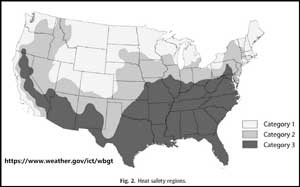
It is interesting to note that the hotter and more humid parts of the country, Region/Category 3 (dark grey) have higher allowable WBGT index readings and the cooler, less humid regions have lower allowable index readings.
The Washington Post and CarbonPlan produce an advanced globe graphic claiming to show “Number of days in 2030 with highly dangerous heat in the sun” (using WBGT as the determining factor) for cities all over the world. I cannot reproduce the graphic here, but please follow the link to see the Post article, the rotating globe graphic is about halfway down. They use the miracle of supercomputers to produce knowledge about the future.
Can the method used by CarbonPlan possibly produce reliable and accurate estimates of WBGT heat stress, even for the past based on available data, no less for the future? Quickly glance down the linked methods page and count the number of assumptions, guesstimates, default values, fudge-adjustments and … it is far too long and complex to include here. Ridiculous! I don’t think it stands any chance producing anything even vaguely accurate at all. It is no better than saying: “It gets hot and muggy in Louisiana in the summertime.” And the same for Bangalore.
To give yourself an example of what is needed to determine the WBGT for a single location and time, visit OSHA’s WBGT Calculator. The calculator asks for the following information: the precise day and time, to the minute; time zone (for the time given); latitude; longitude; dry bulb air temperature; relative humidity; wind speed (in mph); barometric pressure (in inches of Hg); wet bulb temperature (uses a default value if unknown); solar irradiance (W/m2) (uses default if unknown). Using data from a National Estuarine Research Reserve System weather station number 8518962 on the Hudson River in New York State, which gives most of the needed information (some conversions necessary), the WBGT Calculator returned the following:
Outputs
29 C / 84 F — WBGT if in direct sunlight (assumes no clouds and a clear sky with an estimated solar irradiance of 487 W/m2).
23 C / 73 F — WBGT if in shade (assumes a sheltered/shady outdoor location with solar irradiance = 0 W/m2).
*** NOTE *** If clouds were present, the WBGT likely was between the “direct sunlight” and “shade” estimates given above. This calculator does not attempt to adjust the WBGT for cloud cover. The reason is that such an adjustment depends on many factors–e.g., cloud thickness, cloud height, number of cloud layers, and whether or not the cloud was blocking the sun–that are difficult or impossible to determine in retrospect.
Are you beginning to see the difficulties in WBGT calculation – even for a single location and a single time? Again, clouds, and their multi-layers uncertainties, get in the way. Notice the range between WBGT (Sun) and WBGT (Shade), all else being the same. And this is with a known wind speed, another wholly local element, which requires direct measurement and not estimation.
So, can anyone produce a wide-area map of the WBGT index for yesterday? I don’t think so, not without a great deal more and more detailed information than is usually available from our even best weather stations.
To measure heat stress conditions, a heat stress meter, which measures inputs and calculates WBGT, is needed. U.S. Occupational Safety and Health Administration (OSHA) says this: “WBGT measurements are most reliable when taken at, or as close as possible to, the work area. When a worker moves between two or more areas with different environmental conditions, or when the conditions vary substantially in the work area, assess the heat hazard using representative measurements for the different conditions.” For OSHA, this may mean measuring WBGT in each room or area of a worksite. For school sports, “The WBGT [device] should be set up in the sun, not under shade. If you are practicing on turf, it should be set on the turf.” [ source ] Not just anywhere at the school, not on the school quad or outside the principal’s office window, but actually on the playing field in the stadium where conditions will be different than in the spectator stands or on the sidelines.
Bottom Lines:
1. The WBGT index is a superior method of determining potential for heat stress for those working and exercising outdoors in the sun.
2. WBGT depends on very local conditions. These conditions must be accurately physically measured to be reliably used in any WBGT calculation. The use of a purpose-built WBGT meter is recommended. Much of this requirement is because “the formula is very sensitive to the value of the wind speed” — wind speeds must be known to within 0.5-1 mph (0.8-1.6 km/hr) and are very sensitive to cloud cover, on which the value of solar irradiance hinges, which can change minute-to- minute and hour-to-hour.
3. Claims to show wide-area WBGT index figures are suspect at best – WBGT is not a wide-area metric, but a local metric by its very nature.
4. Obviously, if wide-area present-time WBGT calculations cannot be performed reliably, future wide-area prediction, such as that attempted by CarbonPlan, cannot be possibly made with any scientific degree of confidence.
# # # # #
Author’s Comment:
The Post/CarbonPlan “heat stress map of the future” is a fine example of what I have called computational hubris. And results are shown in a “pretty pictures-manner – using a pretty picture to put forward a biased version of reality – usually in a way that does not explain anything.
Again, in an effort push “dangerous heat”, the Post and CarbonPlan have misrepresented a heat stress index meant to be used very locally as something that can be calculated not only over spatially broad areas, which it cannot, but for the future.
I’d like to hear your opinions.
Thanks for reading.